Variables:
- $FPM_VERSION
- for example: 8.2, 7.4 etc
-
install the xdebug package with "sudo apt-get install php$FPM_VERSION-xdebug"
-
add the following to the /etc/php/$FPM_VERSION/fpm/php.ini files
[xdebug]
zend_extension=xdebug.so
xdebug.mode=debug
xdebug.start_with_request=yes
xdebug.client_port=9003
"xdebug.so" is the .dll file equivalent from windows, and comes with the xdebug package that is specific to the php fpm version you installed earlier.
Make sure to use the value provided to "xdebug.client_port" in the later steps.
-
install the "PHP Debug" extension id "robberphex.php-debug" by Robert Lu
Consider also checking out the documentation provided by him. There is an English version available.
-
add the VS Code configuration
-
click "Run" button at the top
-
click "Open configurations"
-
use the sample configuration
{
  "version": "0.2.0",
  "configurations": [
    {
      "name": "Listen for XDebug",
      "type": "php",
      "request": "launch",
      "port": 9003,
      "xdebugSettings": {
        "show_hidden": 1,
        "max_children": 128,
        "max_data": 1024,
        "max_depth": 3
      }
    }
  ]
}
Not everything here is mandatory.
This sample should work right away, without being underlined as a warning or error. Make sure you used the right port from before.
Edit this configuration according to the documentation of the aforementioned PHP Debug extension.
- The opened configuration file is launch.json.
-
-
try the debugger
-
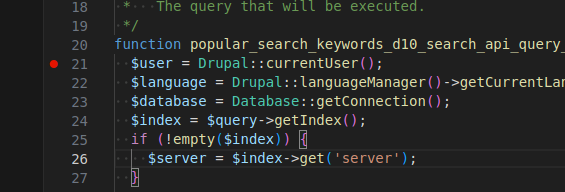
add a breakpoint to any php file
I'm referring to the breakpoints that can be added directly in the VS Code UI, like so:

-
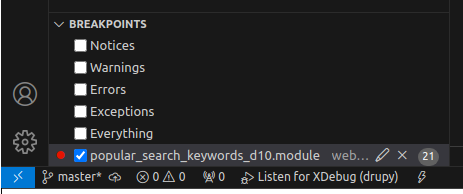
navigate to the VS Code debug tab
-
enable the breakpoints that you want to trigger
You may want to only ever trigger a breakpoint that you have set. Those get automatically selected, but you can also turn them off.

-
start the debugger
Either
- press F5
- Run -> Start debugging
- press green triangle at the top of the debug UI
This will not automatically run any code. See next step.
-
make the code that contains the breakpoints you are interested in execute
This can be done in any way, including navigating to webpages that trigger the code execution.
Watch out for caches ruining your day.
No query parameter is necessary unless you configured launch.json in such a way.
-
There are other ways of achieving this besides the way described here, but this is what worked for me.
Specifically, the "PHP Debug" extension id "xdebug.php-debug" by Xdebug themselves didn't work for me, both with identical and adapted configuration that corresponds to their docs.
The extension "PHP Debug" id "tiansin.php-debug" by tiansin also didn't work properly.


